

Hiring the right people isn’t about flashy stats like the number of applications or interviews. It’s about using metrics that align with business goals - like quality, speed, cost, and experience - to ensure long-term success. Here’s what matters:
- Quality of Hire (QoH): Tracks performance, retention, and manager satisfaction.
- Retention Rates: High early turnover signals hiring issues.
- Time-to-Fill: Measures how quickly roles are filled without rushing quality.
- Cost-per-Hire: Balances efficiency with hiring effectiveness.
- Candidate Experience: Metrics like Net Promoter Score (cNPS) and offer acceptance rates reflect the hiring process's appeal.
Companies that focus on these actionable metrics outperform those chasing vanity stats. A balanced approach ensures smarter hiring decisions, improved retention, and better ROI.
::: @figure 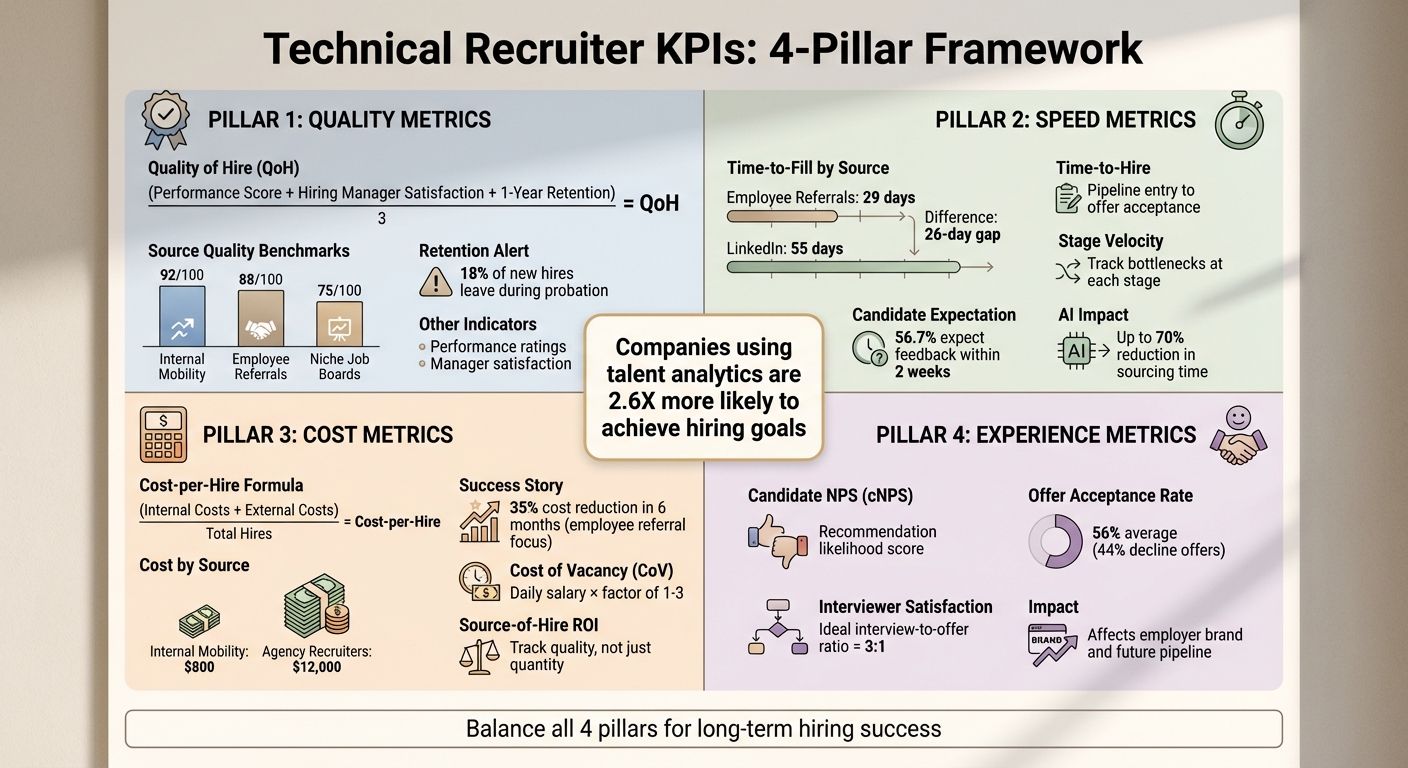 {Technical Recruiter KPIs: 4-Pillar Framework with Key Metrics and Benchmarks}
The 4-Pillar Framework for Technical Recruiter KPIs
Effective recruiting relies on balancing four key areas: Quality, Speed, Cost, and Experience. Companies that use talent analytics are 2.6 times more likely to achieve their hiring goals . These pillars serve as a guide for making smarter decisions.
This framework helps avoid common pitfalls. For instance, a low cost-per-hire might seem impressive, but if it comes from cutting corners on quality, it could lead to higher turnover and replacement costs. Similarly, rushing to fill a role might backfire if the new hire underperforms or leaves within 90 days. As Vicky Liu from Juicebox puts it:
"The most critical KPI of recruitment isn't just a number; it's the compass that guides every strategic decision, ensuring you're not just moving, but moving in the right direction."
The goal is to optimize all four pillars at once, creating a hiring process that delivers long-term value.
Quality Metrics: Measuring Hiring Success
Quality metrics show whether your hires are thriving in their roles, but they can be tricky to measure.
Quality of Hire (QoH) is often seen as the gold standard. One popular formula combines three factors: (Performance Score + Hiring Manager Satisfaction + 1-Year Retention) / 3 . Data from 2026 reveals that internal mobility scores highest with an average QoH of 92/100, followed by employee referrals at 88/100, and niche job boards at 75/100 .
Retention rates offer early clues about hiring quality. Tracking 90-day retention helps identify immediate mismatches, while first-year retention highlights longer-term fit issues. With nearly 18% of new hires leaving during probation , it's crucial to monitor early retention. High attrition often signals problems like inaccurate job descriptions, ineffective interviews, or mismatched expectations.
Other indicators like new hire performance ratings and hiring manager satisfaction provide additional insight into whether new employees are meeting expectations and adding value.
Speed Metrics: Reducing Time-to-Hire Without Sacrificing Quality
Speed matters in technical recruiting because top talent moves quickly, making a hiring timeline planner essential for staying competitive. However, focusing solely on speed can lead to mistakes, so it’s important to balance it with quality.
Time-to-Fill measures the duration from job requisition approval to offer acceptance. This metric is especially valued by executives because it reflects how quickly business needs are addressed. For example, employee referrals average 29 days to fill a role, while LinkedIn averages 55 days . That 26-day gap can mean the difference between securing a top candidate or losing them.
Time-to-Hire focuses on the time from when a candidate enters your pipeline to when they accept an offer, highlighting the recruiting team’s efficiency.
Stage velocity tracks how candidates progress through each stage of the process, identifying bottlenecks. For instance, if candidates often stall at "Hiring Manager Review", it may point to misalignment rather than a sourcing issue .
Keep in mind that 56.7% of applicants expect feedback within two weeks . Slow processes can harm the candidate experience and lower acceptance rates. Tools like AI-powered sourcing can cut initial sourcing time by up to 70% , allowing you to move faster without cutting corners.
Cost Metrics: Tracking Hiring Efficiency
Cost metrics highlight the return on investment (ROI) for recruiting efforts, helping allocate resources effectively. However, a low cost-per-hire isn’t a win if it compromises quality.
Cost-per-Hire (CPH) is calculated as: (Internal Recruiting Costs + External Recruiting Costs) / Total Number of Hires . For example, internal mobility costs about $800 per hire, while agency recruiters cost around $12,000 . While $12,000 may seem high, it’s a better investment if the hire stays for five years compared to an $800 hire who leaves in three months.
Source-of-Hire ROI links spending to outcomes by tracking not just the number of hires from each channel but also their quality. One tech company cut its cost-per-hire by 35% in six months by reallocating funds from general job boards to employee referral programs .
Another useful metric is the Cost of Vacancy (CoV), which calculates the daily revenue loss from an unfilled role. This is done by multiplying the daily salary equivalent by a factor of 1–3, depending on the role’s economic impact . This can help justify spending on faster, higher-quality hires.
Experience Metrics: Improving Candidate and Stakeholder Satisfaction
Experience metrics measure how candidates and hiring teams feel about your process, directly influencing your employer brand and future hiring success .
Candidate Net Promoter Score (cNPS) gauges whether candidates would recommend your company, regardless of whether they were hired. A positive experience encourages future applications and referrals, while a negative one can hurt your talent pipeline. By 2026, cNPS has become a standard measure to ensure that cost-cutting and speed don’t harm your employer brand .
Offer Acceptance Rate (OAR) reflects how appealing your company is to candidates. Current data shows an average OAR of 56% , meaning nearly half of offers are declined. Low acceptance rates can point to problems like compensation, employer branding, or unrealistic job expectations.
Interviewer satisfaction measures whether hiring managers find the process effective and are happy with candidate quality. Ideally, the interview-to-offer ratio should be 3:1. If managers are interviewing too many candidates to make one offer, it may signal screening issues .
As Greenhouse wisely notes:
"Recruiting KPIs act as signals of what's going well, where there's room for improvement and what might need further investigation."
Up next: evaluating your talent pipeline to keep your recruitment efforts running smoothly.
Pipeline Health Metrics: Monitoring Your Talent Pipeline
Pipeline health metrics help you determine if your talent funnel has enough candidates to meet hiring goals. These metrics work alongside key performance indicators (KPIs) for quality, speed, cost, and experience by predicting hiring outcomes. Essentially, they reverse-engineer the process, starting from a single hire to calculate how many candidates are needed at each stage. This approach lays the groundwork for analyzing conversion rates at every step.
Conversion rates by stage measure the percentage of candidates moving through each phase of the hiring process. For instance, if you reach out to 100 candidates and 20 respond, your outreach-to-response conversion rate is 20%. If 10 of those 20 proceed to screening, the response-to-screening rate is 50%. By tracking these rates, you can identify where candidates drop off. A low outreach-to-response rate might point to weak messaging, while a high drop-off between interviews and offers could suggest a mismatch between candidate qualifications and job requirements .
Pipeline coverage ratios help you determine how many candidates you need at the top of your funnel to meet hiring targets. For example, if historical data shows you need 50 outreach attempts per hire and you aim to fill 10 roles this quarter, you’ll need 500 candidates in your pipeline. A hiring pipeline calculator, combined with your past conversion rates, can help you set accurate weekly outreach goals instead of relying on guesswork.
The applicant-to-hire ratio compares the total number of applicants to the number of hires. Breaking this ratio down by stage can reveal whether your sourcing prioritizes quality or quantity. A high ratio often signals issues like poorly written job descriptions, ineffective ad targeting, or an overly complicated application process that discourages top candidates . Ideally, the submit-to-interview ratio should be 1:1, meaning only candidates who genuinely meet the hiring manager’s criteria should advance to interviews . Monitoring applicant-to-hire ratios can help you shift resources toward sourcing methods that deliver the best results .
If your visitor-to-applicant conversion rate is low, consider simplifying the application process and revising job descriptions to attract better-qualified candidates . Additionally, AI-driven screening tools can manage large applicant volumes efficiently, helping you identify top candidates faster while maintaining quality .
Building a Technical Recruiting Dashboard: Tools and Best Practices
A well-designed recruiting dashboard isn't just a nice-to-have - it’s a central tool for making informed, real-time decisions. It helps identify pipeline bottlenecks, track candidate follow-ups, and streamline the entire hiring process . To start, use your Applicant Tracking System (ATS) as the backbone for your dashboard, ensuring you audit your tech hiring stack to remove overlaps. Make sure every applicant’s source - whether it’s referrals, job boards, or sourcing platforms - is tagged accurately. Then, combine ATS data with Google Analytics to identify which sourcing channels bring in not just quantity but quality candidates . For technical roles, integrating platforms like CoderPad can add objective skill-testing data directly into your dashboard. This allows you to measure screening efficiency and monitor metrics like interviews-per-hire .
Instead of trying to track every possible metric, focus on 3–5 high-impact KPIs each quarter . Define these metrics clearly and stick to consistent tracking methods to avoid confusion in reporting . For qualitative insights, use survey tools to gather feedback through Net Promoter Score (NPS) surveys from both candidates and hiring managers . Automating reports is another key step - look for an ATS with an open API that can sync recruiting costs with your ERP system, enabling real-time cost-per-hire monitoring . This streamlined approach ensures your team focuses on the metrics that truly matter.
Data accuracy is critical. Use ATS tools to flag inconsistencies and ensure your dashboard reflects up-to-date, reliable information . Segment your data by role, department, or recruiter to uncover delays that might be hidden in overall averages . It’s worth noting that while 82% of companies consider data essential for talent acquisition decisions , many still rely on outdated spreadsheets instead of centralized dashboards.
To keep everyone aligned, make your dashboard accessible to the whole team. Whether it’s displaying it on shared screens or sending automated weekly reports, visibility creates accountability and keeps goals front and center . Set specific targets for each recruiter so performance can be measured against clear benchmarks, not just raw activity numbers . This transparency encourages continuous improvement in your recruiting strategy.
Tools like daily.dev Recruiter simplify the process by offering built-in analytics for sourcing effectiveness. With features to track warm introduction acceptance rates, developer engagement, and time-to-response, you can manage everything in one place. No more juggling spreadsheets or dealing with irrelevant data - just actionable insights that help you focus on conversations that lead to hires.
Conclusion
When it comes to technical recruiting, it's crucial to focus on KPIs that directly influence business outcomes rather than getting distracted by vanity metrics. Recruitment analytics don’t just show what’s happening - they provide actionable insights to help you course-correct when needed . Metrics like high application volumes or numerous interviews might seem impressive but don’t necessarily translate to long-term hiring success. The real game-changers are metrics tied to retention, mitigating revenue risks, and fostering team stability over time.
The 4-pillar framework - quality, speed, cost, and experience - serves as a reminder to keep your insights balanced and actionable. For instance, prioritizing speed over quality might reduce Time-to-Fill, but it could also compromise hiring standards . By tracking metrics like Quality of Hire alongside Time-to-Fill, Cost of Vacancy, and Candidate NPS, you can identify tradeoffs before they harm your tech talent pipeline or employer brand. In fact, companies that leverage talent analytics are 2.6 times more likely to exceed their hiring goals - but only if they focus on metrics that truly make an impact.
A well-designed dashboard can bring these metrics to life. Concentrate on 3–5 high-impact KPIs each quarter to address major bottlenecks, whether they’re related to quality, approval delays, or candidate experience. Automating data collection ensures the dashboard stays actionable. And here’s a practical tip: if a metric doesn’t drive action, it’s time to remove it .
Balancing quality, speed, cost, and experience is the cornerstone of continuous improvement. Use your dashboard to pinpoint where candidates drop off, identify sources that yield high-retention hires, and flag roles that pose the biggest risks when left unfilled. By refining your KPIs over time, you can transform recruitment from a reactive process into a strategic advantage - one that safeguards product timelines, investor trust, and team morale .
FAQs
What are the most important technical recruiter KPIs?
When it comes to technical recruiting, the most valuable metrics focus on the effectiveness and quality of the hiring process, rather than just tracking activity levels. Here are some key performance indicators (KPIs) that matter most:
- Quality of Hire: This metric measures how well new hires perform and how long they stay with the company. It’s a direct reflection of hiring success.
- Time-to-Hire and Time-to-Fill: These track the speed of the recruitment process, from identifying candidates to filling the role.
- Cost-per-Hire: This highlights the financial efficiency of the hiring process.
Additionally, metrics like candidate satisfaction, offer acceptance rate, and pipeline health ensure that candidates have a positive experience and that there’s a consistent flow of qualified talent. These KPIs help recruiters maintain a balanced and effective hiring strategy.
How can I consistently measure quality of hire?
To evaluate the quality of hire effectively, consider combining performance scores, retention rates, and hiring manager satisfaction. Assign weight to each factor according to your organization's priorities, as there’s no one-size-fits-all formula. This method helps you stay aligned with your unique goals while ensuring consistent measurement.
Which recruiting metrics should I prioritize on a dashboard?
Start by tracking metrics that reveal the effectiveness and quality of your hiring process. Key areas to focus on include:
- Quality of hire: This looks at how new hires perform and how long they stay with your company. It's a clear indicator of whether you're bringing in the right talent.
- Time-to-fill: Measures how quickly you can fill open roles. Faster hiring can mean you're meeting business needs efficiently.
- Cost-per-hire: Tracks how much you're spending to bring in new employees, helping you assess the efficiency of your recruitment budget.
- Candidate satisfaction: Gauges how applicants feel about their experience throughout the hiring process, which can impact your employer brand.
These metrics offer actionable insights and help align your recruitment strategy with business goals. Avoid getting distracted by vanity metrics like the number of applications received or candidates sourced - they don't necessarily reflect hiring success.
.png)