

Recruitment funnel metrics help you measure the success of your hiring process, but tracking the wrong ones can lead to wasted time, money, and effort. Many teams focus on vanity metrics like application volume, which look impressive but don’t reveal actual hiring efficiency. Key issues include inconsistent metric definitions, cluttered dashboards, ignoring stage conversion rates, and relying on outdated manual reporting methods.
To avoid these mistakes:
- Track actionable metrics like interview-to-offer ratios and source-of-hire effectiveness.
- Standardize metric definitions across teams to ensure reliable data.
- Use automated tools for real-time insights and error-free reporting.
- Focus on conversion rates between each funnel stage to identify bottlenecks.
Tools like daily.dev Recruiter simplify tracking by providing clean data, integrated dashboards, and better candidate targeting, ensuring your recruitment process is efficient and data-driven. By addressing these common pitfalls, you can improve hiring outcomes and reduce costs. For a step-by-step guide, follow our data-driven recruitment success checklist.
Common Mistakes in Recruitment Funnel Metrics
::: @figure 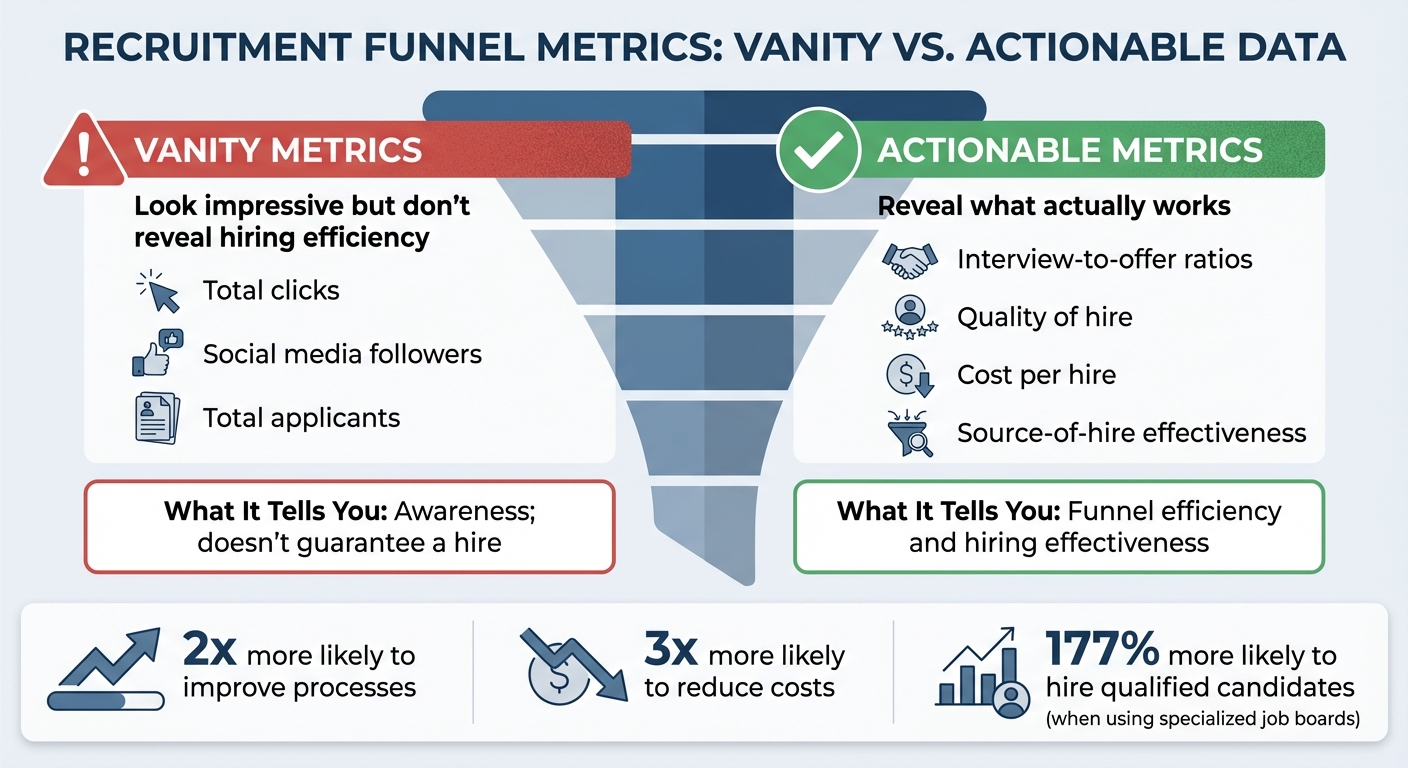 {Vanity Metrics vs Actionable Recruitment Metrics Comparison}
Tracking the wrong recruitment metrics can give the illusion of a strong hiring process while masking underlying issues. If your reports look impressive but your hiring outcomes tell a different story, you might be falling into one of these common traps. Let’s break down the most frequent mistakes and how they can distort your recruitment performance.
Focusing on Vanity Metrics Instead of Actionable Insights
It’s easy to celebrate when a job posting attracts a flood of applications. But what happens when only a handful of those candidates are actually qualified? Metrics like total clicks, social media followers, or application volume might look good on paper, but they don’t necessarily translate to hiring success. These are vanity metrics - they highlight awareness but don’t provide meaningful insights into your hiring efficiency .
For example, recruitment teams that emphasize actionable metrics - like interview-to-offer ratios or source-of-hire effectiveness - are twice as likely to improve their processes and three times more likely to reduce costs . If you’re pouring resources into channels that bring in unqualified candidates, those high traffic numbers aren’t helping your bottom line.
"By capturing recruitment data at each stage in the funnel, recruiting teams make better decisions." - Toggl Hire
Consider this: public sector organizations that use specialized job boards are 177% more likely to hire qualified candidates than those relying on general boards . This demonstrates the importance of focusing on metrics that reveal what works, rather than just tracking how many people saw your job ad.
| Metric Type | Examples | What It Tells You |
|---|---|---|
| Vanity Metrics | Total clicks, social followers, total applicants | Awareness; doesn’t guarantee a hire |
| Actionable Data | Interview-to-offer ratios, quality of hire, cost per hire | Funnel efficiency and hiring effectiveness |
Inconsistent Metric Definitions Across Teams
Even when the right metrics are tracked, inconsistent definitions can undermine the reliability of your data. For instance, one team might measure "time to hire" from the first interview, while another starts counting from the initial application. These mismatched definitions make it impossible to compare data accurately or identify trends.
Take the confusion between "Time to Hire" and "Time to Fill" as an example - it’s a common source of misalignment . Without standardized metrics, you can’t pinpoint the root causes of delays, whether they stem from a sluggish approval process or slow feedback from interviewers. Worse, inconsistent data can lead to integrity issues, such as recording more hires than offers, which skews critical calculations like offer acceptance rates .
"If you don't strategize early on about what information you need, you're going to spin your wheels collecting data that doesn't tell you much of anything at all." - NEOGOV
For example, the public sector’s average time to fill a position is 119 days - three times longer than the private sector . Without clear definitions, it’s impossible to determine whether delays are due to administrative bottlenecks, lengthy screening processes, or other factors.
Overloading Dashboards With Excessive Data
Dashboards packed with endless charts and metrics can overwhelm even the most data-savvy teams. Trying to track every possible detail often hides the most critical trends under a mountain of irrelevant information .
"Measuring everything can be a bit overwhelming. Results are everything but only when you measure the right ones." - TalentLyft
When dashboards are cluttered, decision-making becomes more difficult, and identifying important shifts in recruitment performance takes longer. Instead of tracking everything, focus on the metrics that directly align with your hiring goals. Ignoring key conversion rates only makes it harder to improve recruitment efficiency.
Overlooking Conversion Rates Between Funnel Stages
It’s one thing to track the total number of applications and hires, but the real value lies in understanding how to optimize recruitment funnel conversion rates. Without this data, you risk missing bottlenecks that could be slowing down your hiring process .
For instance, a low application-to-interview conversion rate might suggest your application process is too complicated. This is a valid concern, considering that up to 60% of candidates abandon applications they find too long . Even though the average time to fill a position ranges from 26 to 34 working days , that figure is meaningless unless you know where delays are happening.
By calculating yield ratios at each stage, you can identify exactly where candidates are dropping out. Whether it’s a cumbersome application process or delayed interview feedback, stage-by-stage data helps you fix inefficiencies.
Relying on Manual and Outdated Reporting Methods
Using manual methods like spreadsheets to track recruitment metrics introduces delays and errors. Weekly or monthly updates often mean decisions are based on outdated data, and by the time you’ve compiled last month’s numbers, the hiring landscape may have already shifted.
Manual tracking also struggles with capturing skipped stages in applicant tracking systems, leading to errors like recording more hires than offers . Modern tools can solve this by automatically updating stages - for example, marking a candidate as "Offered" when they reach the "Hired" stage. This ensures data accuracy and saves valuable time.
"Real-time data is essential for maintaining data integrity and making timely hiring decisions." - TalentLyft
Outdated tracking methods not only slow down your process but also increase the risk of inconsistent decision-making, which can harm your employer brand. To stay competitive, real-time, automated reporting is no longer optional - it’s a necessity.
How to Avoid Common Recruitment Metric Mistakes
A few strategic tweaks can help you sidestep common pitfalls and improve both the accuracy and efficiency of your recruitment tracking.
Standardize Metric Definitions and Reporting
Inconsistent metric definitions are a recipe for unreliable data. To fix this, establish clear and universal definitions for every stage of the candidate journey - whether it's Aware, Engaged, Considering, or Hired . For example, if one team measures "time to hire" starting from the first interview and another begins at the initial application, your data will be inconsistent and hard to trust.
Using a centralized Applicant Tracking System (ATS) or Talent Acquisition platform ensures that all recruiters track metrics in one place . This eliminates the chaos of juggling multiple spreadsheets or disconnected tools. Plus, syncing external reporting tools with your ATS data prevents discrepancies that could skew critical calculations .
"After all, to create a never‐ending pipeline of talent, you must have an accompanying never‐ending process of refinement and improvement." – Jobvite Recruiting Funnel Benchmarks Report
Once you’ve standardized definitions, automation can help provide timely and error-free insights.
Use Automated Tools for Real-Time Insights
Manually managing spreadsheets and generating weekly reports slows down decision-making. Automated systems offer real-time dashboards that let you track candidate pools, recruiter performance, and hiring manager feedback as it happens . By removing delays and reducing errors tied to manual data entry, automation delivers accurate insights right when you need them.
Many of these tools enhance data integrity with features like "Infer Stages", which automatically fills in skipped funnel stages to prevent gaps in reporting . For example, CDW, a major technology solutions provider, used Jobvite's ATS and career site tools to streamline its application process. By automating workflows and optimizing job descriptions, CDW achieved an impressive 83% application conversion rate, far surpassing the industry average of 20% to 30% .
Automation can also make screening more efficient by incorporating coding-focused candidate sourcing tools like skills assessments and pre-recorded video interviews, giving you measurable data points instead of relying solely on intuition . Teams leveraging advanced analytics are twice as likely to improve recruiting efforts and three times more likely to achieve cost savings and efficiency gains through automation .
With automation ensuring real-time accuracy, you can focus on the metrics that truly matter.
Focus on Key Metrics and Stage Conversion Rates
Instead of trying to track every possible metric, concentrate on those that directly influence hiring outcomes. For instance, quality of hire is a critical metric for understanding the long-term impact of your recruitment efforts. It evaluates how well new hires perform and their retention rates . Combine this with source of hire to identify which channels - like referrals, job boards, or social media - are producing the best candidates, allowing you to reallocate budgets from underperforming sources .
Stage-wise conversion rates are another key focus. These metrics help pinpoint where candidates drop off in the process. For example, the industry average for the application-to-interview ratio is 8.4%, while the interview-to-offer ratio stands at 36.2% . If your numbers fall below these benchmarks, you’ll know where to dig deeper. A low application completion rate, for instance, often indicates that your application form is too long or complex . This is especially critical when 57% of job seekers lose interest if the hiring process feels too lengthy .
Here’s a quick breakdown of key metrics to track at each funnel stage:
| Funnel Stage | Key Metric to Track | Purpose |
|---|---|---|
| Awareness/Attraction | Source of Hire | Identify the most cost-effective recruitment channels |
| Application | Completion Rate | Pinpoint friction points in the application process |
| Screening | Qualified Candidate Rate | Measure the effectiveness of job descriptions |
| Interview | Interview to Offer Ratio | Evaluate the quality of the screening process |
| Hiring | Offer Acceptance Rate | Assess whether compensation and culture align with market expectations |
Hiring engineers?
Connect with developers where they actually hang out. No cold outreach, just real conversations.
How daily.dev Recruiter Improves Funnel Optimization
When it comes to tracking recruitment funnel metrics, the quality of your data largely depends on how and where you source candidates. daily.dev Recruiter takes a fresh approach to this challenge by cutting through the noise of cold outreach, which often results in single-digit response rates . With its double opt-in introduction system, the platform ensures every candidate interaction is intentional and measurable. Instead of focusing on vanity metrics like "emails sent" or "profiles viewed", you’ll be tracking meaningful indicators - such as interest and responsiveness from developers who have already shown they’re open to opportunities. This method keeps your funnel data clean and avoids inflating top-of-funnel numbers with unqualified or disinterested candidates.
The platform also offers integrated funnel dashboards that make it easier to identify where candidates drop off or where bottlenecks occur in the process. You can break down performance data by recruiter or department, helping you quickly spot and address inconsistencies in how metrics are tracked. Features like engagement-based targeting provide insights into the quality of outreach-to-interest conversions, while automated questions and activity verification during screening ensure candidates align with technical requirements before investing time in manual reviews.
Because daily.dev Recruiter connects you with developers who are already active on the platform - reading, learning, and engaging regularly - you’re working with pre-qualified, passive talent rather than chasing outdated profiles or cold contacts. This naturally improves stage conversion rates, as candidates entering your funnel are more likely to move forward in the hiring process. Additionally, the warm, high-context introductions reduce the usual friction that can lead to candidate drop-off between the application and interview stages.
To top it off, the platform integrates seamlessly with your ATS and sourcing tools, ensuring that data flows directly into your existing systems without manual entry errors. This real-time, automated sync eliminates the inconsistencies that often come with disconnected spreadsheets or multiple tracking methods, giving you actionable metrics you can rely on.
Conclusion
Tracking recruitment funnel metrics isn't just about gathering numbers - it’s about creating a clear and effective hiring pipeline that pinpoints where candidates drop off . By focusing on actionable data instead of vanity metrics, you can allocate your budget more effectively, enhance the candidate experience, and base hiring decisions on solid evidence rather than intuition. In fact, companies with advanced analytics practices are twice as likely to improve their recruiting efforts and three times more likely to cut costs and boost efficiency . This transition from surface-level metrics to meaningful insights is the foundation of every recommendation provided here.
The missteps highlighted in this article can directly impact your bottom line, leading to wasted resources and poor hiring outcomes. Getting your funnel metrics right is the key to shifting from spending on ineffective channels to building a predictable and scalable hiring process.
Tools like daily.dev Recruiter tackle these challenges head-on by delivering clean, actionable funnel data through warm, double opt-in interactions. Its integrated dashboards and automated tracking eliminate manual reporting errors vs. automated ATS integration, ensuring accurate data flows seamlessly into your existing systems. This streamlined approach addresses many of the pitfalls discussed earlier.
With these improvements in place, you’ll gain the ability to forecast with precision. You’ll know exactly how many candidates are needed at the top of the funnel to hit hiring goals, which sources provide the highest quality hires, and where bottlenecks are slowing you down. This level of insight turns recruitment from a reactive, last-minute scramble into a strategic, forward-thinking function that delivers measurable business results. By making these adjustments, you not only refine your hiring process but also set the stage for long-term business success.
FAQs
What are vanity metrics in recruitment, and why should recruiters avoid them?
Vanity metrics might catch your eye with big numbers, but they often lack real value when it comes to evaluating how well your hiring process is working. In recruitment, these include stats like job-posting views, impressions, total application counts, or resume downloads. While they show activity, they don’t reveal whether your efforts are actually delivering results.
Relying too much on vanity metrics can drain time and resources, emphasizing quantity over quality. Sure, you might see more clicks or a flood of applications, but that doesn’t necessarily mean you’re finding better candidates or making better hires. To truly measure success, it’s smarter to focus on time-to-hire, quality-of-hire, and offer acceptance rates - metrics that provide actionable insights and help refine your hiring strategy.
Why is standardizing recruitment metrics important for reliable data?
Standardizing recruitment metrics is key to making sure everyone - whether they’re recruiters, hiring managers, or executives - understands and interprets data in the same way. This clarity removes confusion and makes the data more reliable. For instance, when terms like time-to-fill or candidate conversion rate are clearly outlined, teams can confidently compare performance across roles, departments, or time periods without running into inconsistencies.
Having consistent definitions also cuts down on errors and ensures reports are accurate. Take time-to-fill as an example: if it's always calculated from the moment a job requisition opens to when an offer is accepted, it provides a clear picture of hiring speed without room for differing interpretations. Metrics like this help pinpoint bottlenecks, reveal performance trends, and support confident, data-driven decisions.
With daily.dev Recruiter, users can rely on standardized metrics to uncover meaningful insights, benchmark progress, and refine their hiring strategies - all built on dependable, actionable data.
Why is automated, real-time reporting important for recruitment success?
Automated, real-time reporting gives recruiters an instant snapshot of what's happening at every stage of the hiring process. This transparency makes it easier to spot delays, tweak strategies based on data, and streamline operations.
By tackling problems as they come up, recruiters can speed up hiring, cut down expenses, and create a more seamless experience for both candidates and hiring teams. It's about keeping the process moving efficiently and delivering stronger results.
.png)