

Tech recruiting can feel like guesswork. But with data-driven experiments, you can identify what works, improve hiring processes, and save time and money. Here's the process in a nutshell:
- Pinpoint Problems: Use your ATS to find bottlenecks like high candidate drop-off rates or slow interview scheduling.
- Form Hypotheses: Write testable statements, e.g., “Changing job titles will increase applications by 10%.”
- Run Experiments: Test one variable at a time (e.g., email subject lines) using A/B testing and randomization.
- Track Metrics: Focus on both short-term indicators (response rates) and long-term outcomes (quality of hire).
- Scale Success: Apply what works, monitor results, and make testing a regular part of your hiring strategy.
This approach helps you make smarter hiring decisions and adapt to changing market demands. Let’s dive into the steps.
::: @figure 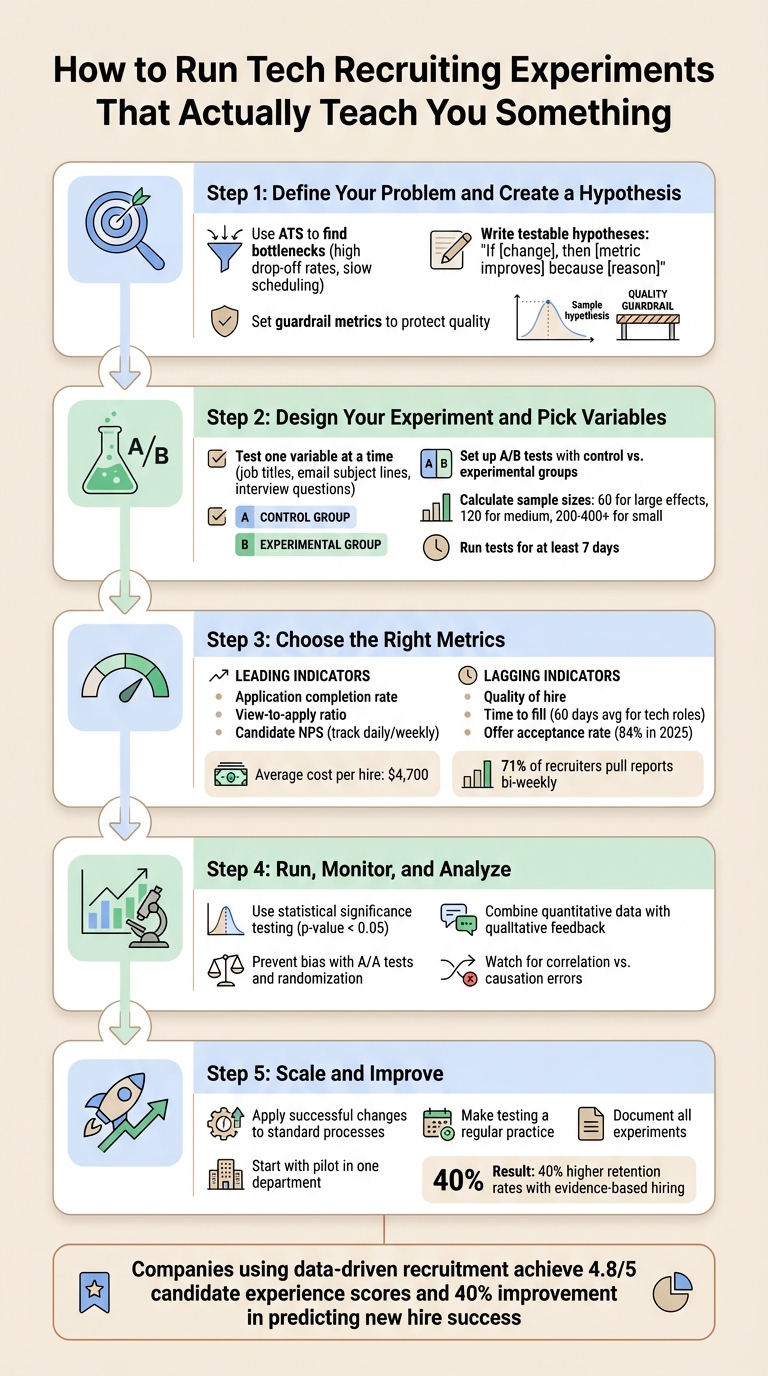 {5-Step Framework for Running Data-Driven Tech Recruiting Experiments}
Step 1: Define Your Problem and Create a Hypothesis
Find the Bottlenecks in Your Process
Before making any changes, take a close look at your recruitment process, from the first point of contact with candidates to the final hiring decision. Identify stages where excessive time is spent on repetitive tasks or where candidates are unexpectedly dropping out .
Your Applicant Tracking System (ATS) can be a goldmine of insights. Use it to pull historical data on metrics like response rates, applicant conversion rates, and time-to-fill. This will help you establish a baseline . Break your candidate funnel into clear stages and track performance at each step to spot areas that need attention . For instance, you might find unusually high drop-off rates at specific points or notice that your screening-to-interview conversion rate is lower than it should be.
However, numbers alone don’t tell the whole story. Pair the data with feedback from candidates and hiring managers to understand the "why" behind the trends . For example, impersonal outreach emails or delays during the interview process could be driving candidates away.
It’s also worth analyzing your sourcing channels to see how they compare in terms of data quality and conversion rates. Are referrals from LinkedIn leading to better hires than job board applicants? Is a virtual job fair generating a lot of applicants but few qualified ones? Laszlo Bock, former SVP of People Operations at Google, emphasizes the importance of clean and accurate data:
"Accurate, accessible data is fundamental to your success today and especially tomorrow. If your data isn't accurate and accessible, any AI you throw at it will just amplify those existing flaws" .
Start by cleaning up your data, then identify the real issues. Once you’ve pinpointed the bottlenecks, you can turn these challenges into specific, testable hypotheses.
Write Testable Hypotheses
Once you’ve identified the problem areas, the next step is to turn them into measurable hypotheses. Use this structure:
"If [I make a specific change], then [measurable metrics will improve] because [the change had this effect]" .
This method forces you to be precise about what you’re testing, what you expect to happen, and why. For example, instead of a vague hypothesis like, “Better job postings will improve hiring,” you could say, “If I change the job title from ‘Software Engineer’ to ‘Full-Stack Developer,’ then qualified applications will increase by 10% because the title better matches what candidates search for.” This approach clearly identifies the independent variable (job title), the dependent variable (qualified applications), and includes a measurable prediction.
Don’t forget to frame both a null hypothesis (H0), which assumes no effect, and an alternate hypothesis (H1), which predicts the impact of your change . This balanced approach ensures you’re searching for the truth, not just trying to confirm your assumptions. As LaunchDarkly’s documentation puts it:
"A well-constructed hypothesis has both a positive and negative result defined" .
Finally, set guardrail metrics to ensure that improving one area doesn’t harm another . For instance, if you’re testing a faster screening process to reduce time-to-hire, keep an eye on candidate quality scores to ensure speed doesn’t come at the expense of hiring the right people. Google’s experience with doubling its referral bonus - only to see no significant hiring improvements - illustrates the importance of using balanced metrics to catch issues early . A clear hypothesis with proper controls can save time and resources.
Step 2: Design Your Experiment and Pick Variables
Choose Which Variables to Test
Once you’ve crafted your hypothesis, the next step is to design your experiment by identifying key variables to test. Focus on elements that can significantly influence candidate volume and quality, such as job ad titles, email subject lines, or interview questions . For instance, if your application rates are low, you might experiment with changing the job title from "Software Engineer" to "Full-Stack Developer" to see if it attracts more qualified applicants.
In this process, the independent variable is the aspect you change (e.g., a revamped job description), while the dependent variable is the outcome you measure (e.g., conversion rates or candidate quality) . To accurately assess the impact, test only one variable at a time .
Prioritize variables based on how much they could influence results and how easy they are to implement. For example, since only 44% of companies cover relocation expenses , testing whether offering this benefit attracts more out-of-state candidates could give you a competitive advantage. Similarly, with 74% of recruiters in the national security field now offering remote work options , experimenting with remote-first job postings might help you tap into a larger talent pool. Narrowing your focus to impactful variables ensures a clean and controlled A/B testing process.
Set Up A/B Tests in Recruitment
A/B testing is a method of comparing two versions of something to determine which performs better. Use your current process as the control group and the modified version as the experimental group . To ensure reliable results, both groups should be comparable - same job roles, similar candidate experience levels, and matching demographics - so any differences can be attributed to the change you’re testing .
Randomization is key. Assign candidates randomly to the control or experimental group so the results reflect the impact of your change, not pre-existing differences . Depending on what you’re testing, your "randomization unit" could be individual candidates, specific companies (for B2B sourcing), or even geographic regions . For example, if you’re testing two email subject lines, randomly split your candidate list so half receive version A and the other half get version B.
If you have reliable historical data - like a well-documented response rate for a specific job ad - you can use it as your control group when trying out a new version . Before diving into the full experiment, consider running an A/A test where both groups receive the same experience. This helps verify that your setup is working correctly and that there’s no built-in bias in your sampling . Once your groups are randomized, you’re ready to determine sample sizes and testing durations.
Calculate Sample Sizes and Test Duration
To get meaningful results, you’ll need an adequate sample size. Three factors determine this: Type I error (alpha, usually set at 0.05 for 95% confidence), statistical power (typically 80% or 90%), and the expected effect size . If the effect is large, you’ll need fewer participants. If it’s subtle, you’ll need more.
As a general guideline, plan for about 60 participants for large effects, 120 for medium effects, and 200–400+ for smaller effects . For example, testing a major overhaul of your interview process might only require 60 participants. But if you’re tweaking email phrasing, you’ll likely need at least 200.
To figure out how long to run the test, divide your required sample size by the number of candidates entering your experiment daily . Always run tests for at least one full week to account for variations in behavior between weekdays and weekends . Add a 20% to 30% buffer to your sample size to account for non-responses or drop-outs . If your candidate pool is small, use a finite population correction formula to avoid over-sampling and wasting resources .
Step 3: Choose the Right Metrics
Core Metrics for Recruitment Success
To make informed decisions, select one main metric to guide your efforts, supported by additional metrics to ensure that changes don't negatively impact other parts of the hiring funnel . For instance, if you're experimenting with a new job description, the application-to-interview conversion rate can serve as your primary metric, while metrics like application completion rate and candidate quality scores act as safety checks.
Focus on metrics that align closely with your hiring objectives. For example, Time to Fill (with technical roles typically taking about 60 days ) and the offer acceptance rate (which rose to 84% in 2025 from 81% in 2021 ) are strong indicators of how attractive your company is to candidates. Meanwhile, metrics like the number of interviews per hire (which increased by 40% in 2021 ) highlight how efficiently your hiring process operates.
It’s also crucial to assess your sourcing channels. While job boards account for 49% of applications, they contribute to just 24.6% of actual hires . Testing and evaluating these channels can help you allocate resources more effectively, especially when the average cost per hire hovers around $4,700 .
Track Leading and Lagging Indicators
Once you've established your core metrics, it’s essential to differentiate between leading and lagging indicators. This distinction helps refine how you interpret the results of your experiments. Lagging indicators - such as Quality of Hire, Time to Fill, and attrition rates - offer a snapshot of long-term success . On the other hand, leading indicators like Application Completion Rate, View-to-Apply Ratio, and Candidate NPS provide early signals of potential outcomes .
Leading indicators are valuable for spotting issues early. For example, a decline in View-to-Apply or Application Completion Rates can alert you to problems before they escalate into delays or additional costs. Monitoring these metrics daily or weekly is critical, and 71% of recruiters report bi-weekly to align short-term signals with broader goals .
Lagging indicators, meanwhile, validate the overall effectiveness of your hiring process. Metrics like Quality of Hire - measured through performance reviews and retention rates - and AI-driven insights (endorsed by 61% of talent professionals ) showcase long-term impact. For instance, Cogent Biosciences used Lever's Visual Insights to identify bottlenecks, which helped them reduce time-to-hire and improve offer acceptance rates .
"It's not about perfection when it comes to talent acquisition insights. It's about reviewing the data, adjusting accordingly, and keeping the train on the track." – Christina Schmit, Director of Talent & Culture, Renewal by Andersen
To stay on top of these metrics, use real-time dashboards in your ATS. These tools allow you to monitor leading indicators and make adjustments mid-experiment, ensuring you maintain a positive candidate experience . With a strong framework of metrics, you’ll be well-positioned to analyze your experiments and gain actionable insights.
Step 4: Run, Monitor, and Analyze Your Experiment
Launch Your Experiment
Start your experiment by leveraging your ATS (Applicant Tracking System) to track both quantitative data and qualitative feedback in one place . Set up automated reporting to receive regular updates on candidate engagement and the effectiveness of your sourcing strategies. Fun fact: 71% of recruiters pull data reports at least every two weeks to keep an eye on hiring trends and outcomes early on .
Consistency is key. To truly measure the impact of the variable you're testing, everything else - like sourcing, screening, and interview processes - needs to stay the same for both your control and experimental groups . For example, if you're experimenting with a new job description, make sure candidates in both groups go through an identical interview process. Use your ATS to randomize candidate assignments to avoid any unintentional bias .
Keep tabs on your experiment’s progress with status labels like "pending", "active", or "blocked" to quickly spot and address any hiccups . For a faster way to validate ideas, try "painted door" tests - these involve adding a call-to-action button that leads to a "coming soon" message, letting you gauge interest before rolling out a full feature . A well-planned setup ensures you can monitor and adjust your experiment effectively.
Prevent Bias and Enforce Experimental Rigor
Bias can sneak in and derail even the most carefully planned experiments. Two common offenders are confirmation bias - where people look for data that supports their beliefs - and anchoring bias, which happens when too much weight is given to initial information . To combat these, consider running an A/A test. This involves splitting candidates into two identical groups to check for sampling bias or technical issues before introducing your variable .
Focus on testing one variable at a time, like a single screening question or a new call-to-action, so you can clearly link any outcome changes to that specific variable . Real-world examples show why this matters: Google once doubled its referral bonus but saw no noticeable improvement in hiring . Similarly, AirBnB misinterpreted neutral results until data segmentation by browser revealed a technical bug in Internet Explorer .
Keep your data clean by standardizing how it's entered and conducting regular audits to eliminate duplicates or errors . If you're running multiple experiments, use mutually exclusive layers to ensure candidates aren’t exposed to overlapping tests, which could muddy your results . Running experiments for at least seven days helps account for variations in behavior that might occur on different days of the week .
Analyze Results and Draw Conclusions
When your experiment wraps up, it’s time to dive into the data. Use statistical significance testing to confirm whether your results hold weight. For averages (like interview ratings), t-tests work well, while chi-squared tests are better for binary outcomes (like hired vs. not hired). A p-value below 0.05 indicates that your findings are statistically significant .
The size of your sample determines the best analysis approach. Bayesian statistics are ideal for smaller samples (a few hundred or less) because they calculate the probability of each variation being the best option . For larger samples (in the thousands), frequentist statistics using p-values are more appropriate . Remember, sample size matters - a group of 60 participants might be enough for large effects, but detecting smaller effects requires 200–400+ participants .
Don’t just rely on numbers. Combine your quantitative findings with qualitative insights from post-experiment surveys or interviews with candidates and hiring managers . Segmenting your data by factors like job roles or demographics can also reveal how changes affect different groups . For instance, in July 2024, Cogent Biosciences used Lever's Visual Insights tool to analyze their recruiting data. This helped them cut down on time-to-hire and time-to-fill while boosting their job offer acceptance rate .
"It's not about perfection [when it comes to using talent acquisition insights]. It's about reviewing the data, adjusting accordingly, and keeping the train on the track."
– Christina Schmit, Director of Talent & Culture, Renewal by Andersen
Finally, be cautious about mistaking correlation for causation. Just because two metrics shift together doesn’t mean one caused the other . Use guardrail metrics to ensure that focusing on one area (like speed) doesn’t negatively affect another (like quality of hire) . If your results are inconclusive, think of them as a learning opportunity. Refine your hypothesis, tweak your approach, and test again. Each experiment brings you closer to optimizing your recruitment process.
Step 5: Scale and Improve Based on Results
Apply Successful Changes
Once you've identified what works, it's time to make those improvements part of your regular processes. For example, if testing shows that a particular email subject line boosts candidate responses, set it as the default in your Applicant Tracking System. Similarly, update job descriptions, adjust interview scorecards, and fine-tune sourcing strategies based on the data you've gathered .
GitLab's approach in 2025 provides a great example of how to integrate test results into permanent workflows. Their method ensures that successful experiments are systematically transitioned into everyday practices . But the work doesn’t stop there - ongoing monitoring is crucial. One consulting firm, for instance, increased their accuracy in predicting new hire success by 40% by implementing a validated case interview scoring system. They didn’t just stop at implementation; they kept tracking the system’s performance to ensure it stayed effective .
A smart way to roll out these changes is to start small. Pilot the improvements in one department to gather more evidence and build support across the organization. Once the enhancements prove their worth, embed regular testing into your hiring strategy to keep refining your process over time .
Make Testing a Regular Practice
Think of every successful experiment as a stepping stone, not the final destination. By continuously testing and refining, you can create a recruitment process that evolves with your needs. Many organizations that embrace this mindset have seen impressive results. For instance, companies using data-driven recruitment tools have achieved candidate experience scores as high as 4.8 out of 5 . Axis Bank reached this level by implementing the "Atmos" digital hiring tool from RippleHire under the leadership of CHRO Rajkamal Vempati. This initiative digitized their hiring funnel and made analytics-driven decisions a standard practice .
"Iterative optimization is not a one-time effort but a commitment to ongoing enhancement of recruitment processes." - Elizabeth Parker, Professional HR and Recruitment Writer, Hirebee.ai
To keep things organized, document each experiment, noting its status and the date it was implemented. This creates a clear record of your evolving best practices and helps ensure nothing gets lost in the shuffle . The benefits of this approach are clear: companies that adopt evidence-based hiring methods report 40% higher retention rates compared to those sticking with traditional methods . By embedding continuous improvement into your recruitment process, you're not just keeping up - you’re setting the standard for long-term success.
Conclusion
Key Takeaways for Recruiters
Structured tech recruiting experiments replace guesswork with solid evidence. The process begins by pinpointing specific bottlenecks in your hiring funnel and creating testable hypotheses. A helpful format for this is: "If we [change], then [metric] will improve because [reason]" . From there, you set up controlled experiments with clear variables, calculate the appropriate sample sizes, and focus on metrics that truly matter. These include primary metrics, like offer acceptance rates, and secondary ones, like candidate experience, to ensure a balanced approach .
Moving from intuition to data transforms recruitment into a strategic advantage. Organizations that implement standardized, data-driven methods not only reduce unconscious bias but also improve hiring quality and build trust with candidates through fair and transparent processes . As Priya Nain from RippleHire puts it:
"Data-driven recruitment isn't about removing human judgment... Think of it as adding night-vision goggles to your existing expertise – you're still the one making the decisions, but now you can see things that were previously invisible" .
These insights lay the groundwork for meaningful improvements. The next step is to take these findings and turn them into actionable, long-term changes.
Next Steps for Improvement
Using the five-step framework, start by tackling the recruitment bottleneck with the most significant impact. Use results from pilot experiments to drive broader changes. Begin small - test within a specific department or for a particular role - before scaling your efforts across the organization . For example, if low response rates to outreach emails or high dropout rates during technical screens are major pain points, design a straightforward A/B test to address them.
Continuous experimentation leads to lasting progress. Companies committed to regular testing have reported impressive results, including a 40% improvement in predicting new hire success and candidate experience ratings as high as 4.8 out of 5 . By documenting these experiments, you can create a proprietary database to inform and refine future initiatives .
FAQs
What’s the best way to spot bottlenecks in my tech recruiting process?
To identify bottlenecks in your tech recruiting process, start by running data-driven experiments to assess each step of your hiring pipeline. Develop clear hypotheses about where issues might arise - whether it's in sourcing, screening, or scheduling - and measure key metrics like response rates, time-to-hire, or candidate drop-off points. For example, you might analyze how different sourcing channels perform or test alternative interview formats to uncover delays or inefficiencies.
Ensure your data is well-organized and centralized to maintain accuracy in your analysis. Watch for trends that reveal where candidates lose interest or where processes slow down. By consistently testing and fine-tuning your methods, you can zero in on problem areas and make targeted adjustments to improve the efficiency of your hiring process.
What are some examples of hypotheses you can test in tech recruiting?
In tech recruiting, testable hypotheses zero in on specific strategies or changes and their potential outcomes. For instance, you could hypothesize that implementing a new sourcing platform will boost the number of qualified candidates. Or, you might predict that tailored outreach messages will lead to higher response rates. These types of hypotheses are actionable and measurable, making them perfect for testing.
Other ideas worth exploring include evaluating whether a shorter application process reduces candidate drop-off or if structured interviews enhance candidate engagement. By focusing on measurable outcomes - like response rates, candidate quality, or time-to-hire - recruiters can refine their approaches and make smarter, data-informed decisions.
How can I make sure my recruitment experiments are fair and unbiased?
To create a level playing field and minimize bias in recruitment experiments, start by implementing randomized and controlled tests. Randomization ensures candidates are assigned to test groups without any external influence, which helps cut down on unconscious bias.
Rely on objective metrics and standardized evaluation criteria to keep the process fair and free from subjective opinions. Regularly review your data for trends that might reveal hidden biases, and include input from a variety of perspectives when designing your experiments. Being transparent about your methods and results not only builds accountability but also helps you fine-tune your recruitment strategies over time.
.png)