

Hiring fast doesn’t always mean hiring right. For technical roles, traditional recruiting metrics like time-to-fill or cost-per-hire often fail to capture what matters most: quality and retention. Instead, focus on KPIs that measure long-term success.
Key metrics to track:
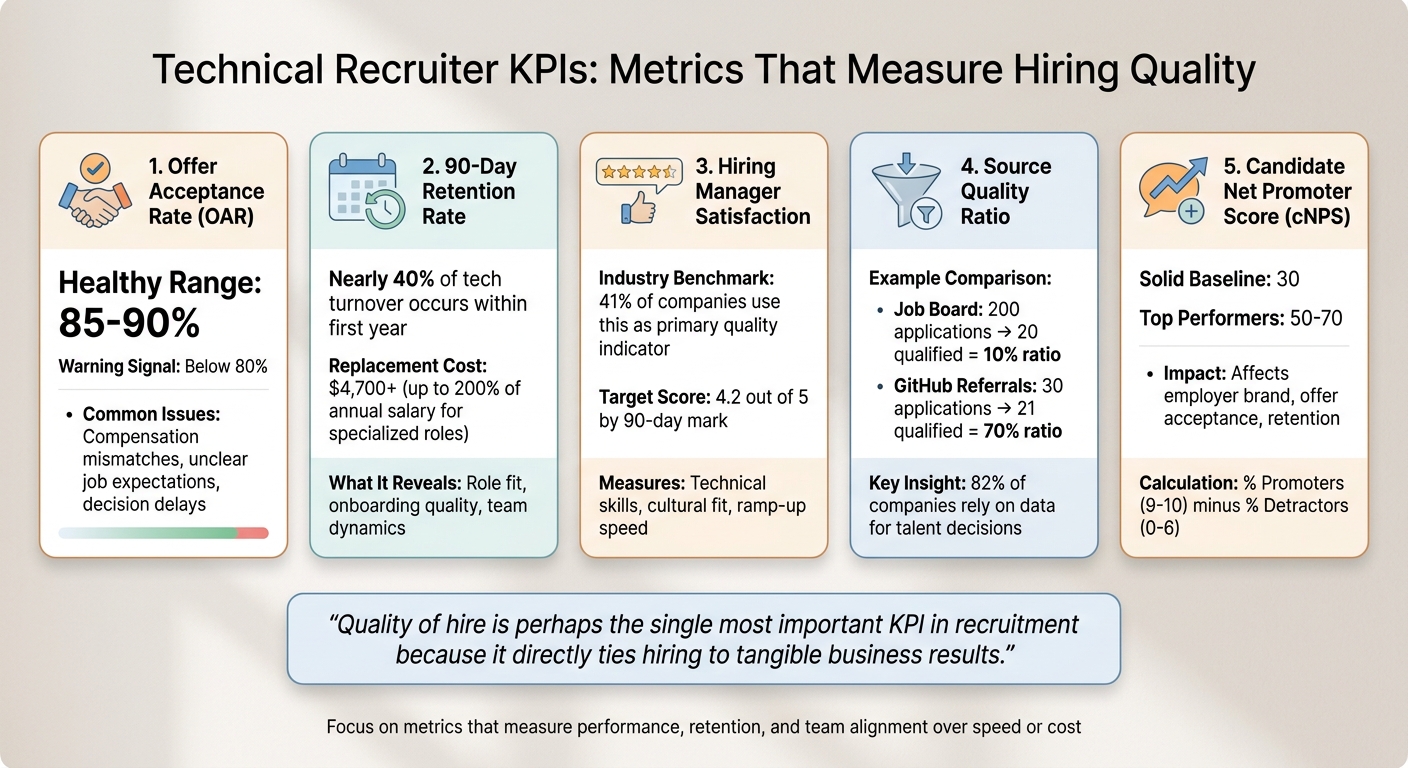
- Offer Acceptance Rate (OAR): Healthy rates fall between 85%-90%; anything below 80% signals issues like compensation or delays.
- 90-Day Retention Rate: High early turnover highlights onboarding or role fit problems.
- Hiring Manager Satisfaction: feedback on technical skills and role fit predicts long-term outcomes.
- Source Quality Ratio: Tracks which sourcing channels deliver qualified candidates, not just volume.
- Candidate NPS: Measures candidate experience to protect your employer brand.
For technical hiring, prioritize metrics that focus on performance, retention, and team alignment over speed or cost. This ensures every hire strengthens your team, avoids costly mistakes, and supports long-term goals.
Why Traditional Recruiting Metrics Fail for Technical Roles
Metrics like time-to-fill and cost-per-hire were originally designed for industries like retail and hospitality, where roles are easier to fill, and training cycles are brief. But when it comes to technical positions, these measures fall short. Technical roles require a precise match of skills and a focus on long-term alignment. Prioritizing speed and cost over quality can lead to hiring missteps that undermine the ultimate goal: securing the right talent.
In fact, rushing to fill a technical role increases hiring mistakes by 11% . And the stakes are high - leaving a technical position vacant costs an estimated $500 per day . A bad hire, especially one lacking the specialized expertise required, can be far more damaging than a temporary vacancy. The ripple effects of such mistakes can hurt team performance and derail long-term success.
"Chasing a low CPH without tracking quality or retention can backfire, since low-quality hires ultimately incur higher long-term costs." - Sage HCM
The tech industry’s median time-to-hire is 48 days (which can be mapped using a hiring timeline planner) - 26% slower than the global average . But this isn't necessarily a sign of inefficiency. Instead, it reflects the reality of a market where 69% of employers report struggling to find candidates with the right skills using traditional coding-focused candidate sourcing tools . This highlights the need for metrics that focus on quality rather than speed.
One of the biggest oversights of traditional metrics is their failure to account for the immense ROI of top-tier technical talent. The best technical employees can deliver up to four times the output of their average counterparts . While cost-per-hire measures efficiency, it completely misses the long-term value that exceptional technical talent brings to a company.
Quality-Focused KPIs: Measuring What Matters
When traditional metrics fall short, quality-focused KPIs help ensure that every hire contributes to long-term team success. These metrics go beyond surface-level activity, showing whether your recruitment process is delivering candidates who accept offers, stay with the company, and perform effectively.
Offer Acceptance Rate
Offer Acceptance Rate (OAR) tracks how often candidates accept job offers. It’s a key indicator of efficiency, as late-stage declines can waste weeks of effort and force teams to restart the hiring process .
An OAR between 85% and 90% is considered healthy , though technical roles often see lower rates due to intense competition. If your OAR drops below 80%, it’s time to investigate. Common problems include mismatched compensation, unclear job expectations, or delays in decision-making . Addressing these issues early - like sharing salary ranges during initial conversations - can prevent surprises later in the process . Short surveys for candidates who decline offers can also shed light on whether compensation, company culture, or competing offers were the deciding factors .
Interestingly, a high OAR combined with high first-year attrition may suggest that roles are being oversold .
"Offer acceptance rate measures how often offers convert into starts. This protects recruiters' time because late-stage declines waste weeks of effort and reset the client timeline." - Tracker
Monitoring this metric alongside early retention rates offers a fuller picture of hiring success.
90-Day Retention Rate
Early turnover often signals deeper issues with hiring quality. The 90-day retention rate measures whether new hires are a good fit for their roles, highlighting mismatches in expectations, technical skills, or team dynamics . This is especially critical for technical positions, where nearly 40% of turnover occurs within the first year . Early exits in these roles can be particularly costly due to complex onboarding processes.
Replacing a technical hire can cost over $4,700 - or even up to 200% of their annual salary for highly specialized roles . If retention rates drop significantly at the 90-day mark, onboarding challenges are often to blame rather than sourcing issues. For example, if those who stay perform well but many leave early, it’s worth reviewing your onboarding process instead of rethinking your sourcing strategy.
To pinpoint problem areas, track retention by hiring source, role type, and hiring manager . If certain channels consistently yield lower retention, consider reallocating your recruitment budget to those with better outcomes . For context, filling a senior engineer role takes an average of 47 days - almost double the time required for general positions . This extended timeline amplifies the financial impact of early turnover.
Hiring Manager Satisfaction Scores
Hiring manager satisfaction scores provide a qualitative measure of how well recruiters understand the technical requirements and team culture . Currently, 41% of companies use these ratings as a primary indicator of hire quality . High-performing recruitment teams aim for an average new-hire performance rating of at least 4.2 out of 5 by the 90-day mark .
"Quality of hire is perhaps the single most important KPI in recruitment because it directly ties hiring to tangible business results." - Sage HCM
Standardized scorecards at the 90-day review can capture manager feedback on a hire’s technical skills, cultural fit, and speed of ramp-up . If satisfaction scores are low, a post-mortem with the hiring manager can help refine job descriptions, improve screening questions, or adjust technical assessments . Breaking down satisfaction scores by team or technology stack can also reveal patterns, such as whether specific technical needs are being consistently misunderstood .
High satisfaction scores at the 90-day mark often predict long-term retention . When combined with retention and offer metrics, these scores contribute to a comprehensive Quality of Hire model. By integrating manager satisfaction with early retention and performance data, you can develop a holistic view of your recruitment success . These insights will inform the Quality of Hire metric, which plays a central role in building an effective KPI dashboard in future steps.
Pipeline Health Metrics: Tracking Candidate Progress
These metrics go hand-in-hand with quality-focused KPIs, ensuring every step of your hiring process contributes to finding top technical talent. A well-functioning pipeline depends on knowing where candidates come from, how they progress through your process, and how they feel about the experience. By focusing on these metrics, you can identify bottlenecks and areas where the candidate experience could use improvement.
Source Quality Ratio
The source quality ratio helps you measure the effectiveness of your candidate sources. It’s the percentage of candidates from a specific channel who meet your minimum qualifications. To calculate it, divide the number of qualified candidates from a source by the total number of candidates from that source, then multiply by 100 . This way, you can avoid wasting resources on high-volume channels that don’t deliver suitable candidates .
For example, a job board might bring in 200 applications, but only 20 meet your criteria - a 10% ratio. On the other hand, GitHub referrals might yield just 30 applications, but 21 are qualified - a 70% ratio. This metric is especially useful, considering that 82% of companies now rely on data to make talent acquisition decisions . It can also help justify reallocating budgets using a tech hiring budget calculator to move funds from underperforming platforms to those that consistently deliver candidates with the right technical skills .
Before diving into this metric, make sure you’ve clearly defined what "qualified" means for each role - whether it’s specific certifications, years of experience, or technical skills . Use your ATS to tag candidates by their source to avoid guesswork. If you notice a low ratio, it might be a sign that your job description isn’t attracting the right audience or clearly communicating the technical requirements .
"Source quality matters more than source volume for 2026 hiring." - Tracker-RMS
Stage Conversion Rates
Stage conversion rates show how candidates move through your hiring process, highlighting where qualified talent tends to drop off . Breaking your pipeline into stages - like sourced to phone screen, phone screen to technical interview, and so on - helps pinpoint inefficiencies.
For instance, if your phone screen-to-technical interview rate is below 60–70%, it could indicate issues with sourcing or candidate fit . Similarly, a technical interview-to-final round rate below 50–60% might mean your initial screening is too loose or your technical assessments are too stringent . If your offer-to-acceptance rate falls below 80%, the problem might lie in uncompetitive compensation, slow decision-making, or a poor candidate experience in the final stages .
For technical roles, expect a screening-to-interview ratio of 8–15% , while a healthy interview-to-offer ratio typically ranges between 4–8 interviews per offer . Breaking these rates down by tech stack - like React versus Python - can help you see which roles face the toughest competition or internal challenges . Tracking "time in process per stage" can also reveal where candidates are getting stuck, such as waiting on feedback or test results . These insights are invaluable for fine-tuning your recruitment funnel.
Candidate Net Promoter Score (NPS)
Candidate NPS (cNPS) measures how likely candidates are to recommend your company based on their recruitment experience. It’s calculated by subtracting the percentage of Detractors (those who rate 0–6) from the percentage of Promoters (those who rate 9–10) . A cNPS of 30 is a solid baseline, with top-performing organizations aiming for scores between 50 and 70 .
This metric is crucial because candidate experiences influence your employer brand. Even candidates who don’t get hired can impact your reputation through online reviews and word-of-mouth . A higher cNPS often correlates with better offer acceptance rates and stronger new-hire retention, as satisfied candidates tend to start their roles more engaged .
"Candidate experiences directly shape your company's employer brand. Even if candidates don't get hired, their opinions matter - they share experiences online and by word-of-mouth to other talent in your industry." - Sage HCM
To track cNPS, send out brief surveys after the final interview or offer stage. Pay attention not just to the score but also to recurring themes in candidate feedback. Segment the results by recruiter or department to identify areas needing attention. By providing timely updates and clear feedback, you can maintain a high cNPS even with rejected candidates, potentially turning them into advocates for your brand.
Sourcing Efficiency Metrics: Optimizing Outreach
Pipeline health metrics show how candidates progress through your hiring process, but sourcing efficiency metrics focus on whether you're targeting the right developers and doing so effectively. These numbers reveal if your outreach resonates with technical talent and whether your time and hiring budget are being spent wisely. Without keeping an eye on these metrics, you might end up wasting resources on channels that produce high volume but low-quality results. Let's break down how response rate, candidate quality, and channel ROI can refine your outreach strategy.
Response Rate
Response rate measures how often developers reply to your outreach messages. To calculate it, divide the number of replies by the total messages sent, then multiply by 100 . This metric gives you a sense of whether your job postings and messages are hitting the mark with your audience.
If response rates are low, it could mean your messaging or targeting is off . Review your job titles and descriptions to ensure they’re clear and competitive . A drop in responses might also signal issues with the role itself - perhaps the compensation isn’t competitive, the job scope is unclear, or your company’s brand appeal isn’t strong enough . By tracking response rates weekly and pairing them with data on outreach volume by channel, you can identify when it’s time to tweak your messaging.
Qualified-to-Contacted Ratio
Next, assess the quality of candidates you’re reaching by examining the qualified-to-contacted ratio . This metric, also known as the qualified candidate rate, measures the percentage of contacted candidates who meet the job’s basic requirements . High outreach volume without quality leads to wasted effort sorting through unsuitable applications . Ideally, this ratio should be above 20%; anything lower suggests inefficiencies in your sourcing strategy .
"A large applicant pool might look impressive, but if only a small fraction are truly qualified, your team might be wasting time filtering and screening." - Sage HCM
Breaking this metric down by sourcing channel - such as comparing general job boards to specialized developer platforms - can pinpoint which sources consistently deliver better-fit candidates .
Channel ROI by Platform
Channel ROI helps you determine which platforms not only bring in applicants but also lead to successful, long-term hires. The formula is simple: (hires from a specific channel ÷ total hires) × 100 . For cost efficiency, track ad spend per platform and divide it by the number of successful hires from that platform .
It’s important to distinguish between where applicants come from and where your hires originate. High-volume channels can sometimes produce lower-quality candidates . Platforms that evaluate coding activity, for instance, often provide better hiring signals than traditional resume sites .
Employee referrals are a standout example of high ROI. They typically cost around $3,000 per hire compared to $15,000 for agency hires and also achieve better retention rates - 95% versus 70% . When calculating ROI, consider both Cost Per Hire (CPH) and Quality of Hire (QoH). The cheapest option isn’t always the best if those hires don’t perform well or stick around . To ensure accurate reporting, make sure your ATS correctly tracks the source of every candidate .
| Metric | Formula | What It Reveals |
|---|---|---|
| Response Rate | (Responses Received ÷ Messages Sent) × 100 | Indicates if your outreach resonates with developers |
| Qualified Candidate Rate | (Qualified Candidates ÷ Total Identified) × 100 | Measures whether you’re reaching the right talent |
| Channel ROI | (Hires from Channel ÷ Total Hires) × 100 | Highlights the most effective platforms |
| Sourcing Channel Cost | Ad Spend per Platform ÷ Successful Applicants | Evaluates cost efficiency by platform |
Speed vs. Quality Trade-Offs in Technical Hiring
Recruiters often face a tough balancing act: move too quickly, and quality might suffer; take too long, and you risk losing top talent. The numbers show that rushing technical hiring is rarely a good idea.
A bad hire can cost a company up to 30% of the employee's first-year salary due to lost productivity and replacement costs . For senior technical roles, the stakes are even higher. A failed executive hire can cost an organization 3-5 times the individual's annual salary, factoring in team disruptions and recovery time . Beyond the financial hit, these missteps can also hurt team morale and overall productivity.
"Quality is speed, and it is the one thing we should never trade if we want to ensure faster delivery." - Mario Caropreso, Senior Engineering Manager, Meta
Low-quality hires create long-term problems by introducing bugs and operational inefficiencies, which ultimately slow down the entire team. While rushing might shave a few weeks off the hiring timeline, it often leads to reduced team productivity compared to teams that prioritize quality from the outset. For example, in late 2025, the CEO of a Series C developer tools company discovered their average time-to-hire was 58 days. A 14-day delay between final interviews and offers was the key bottleneck. By introducing a 72-hour decision deadline for engineering managers, the company cut their time-to-hire to 41 days and boosted their offer acceptance rate from 64% to 83% within six months . This demonstrates how focusing on efficiency without sacrificing quality can protect team performance.
In technology, the median time-to-hire is 48 days, making it 26% slower than the global median across all industries . Yet, 62% of candidates lose interest in a role if they don't hear back within two weeks . The solution isn't cutting corners, like skipping reference checks or reducing screening rigor, but rather eliminating unnecessary delays and indecision. For instance, high-performing tech teams in 2024 interviewed 40% more candidates per hire compared to 2021, not because of better evaluation but due to indecision . The takeaway? Streamline processes where possible - automate admin tasks, reduce bottlenecks - but maintain a strong focus on thorough evaluations of technical skills and team fit. Speed matters, but not at the cost of making the wrong hire.
Setting Up a KPI Dashboard for Technical Recruiting
Once you've identified the metrics that matter most for quality and efficiency, the next step is to bring them together in a clear, focused dashboard. A KPI dashboard hones in on the metrics that truly influence hiring quality. While 82% of companies consider data essential for talent acquisition decisions , many recruiting teams get bogged down by irrelevant or non-actionable data. This dashboard should highlight only the KPIs that directly impact hiring success, avoiding unnecessary clutter. Start small by focusing on 3 to 5 key KPIs per quarter, and ensure everyone involved agrees on what those metrics mean .
It's crucial to establish clear definitions for your dashboard. For instance, decide when "Time to Fill" begins and how to identify qualified technical candidates to prevent any ambiguity . Break down your data by role type (e.g., DevOps vs. Frontend), department, or even recruiter. This segmentation helps pinpoint bottlenecks in your process, rather than masking issues with broad averages . Below, we'll explore the tools and reporting practices that can make your dashboard a powerful tool for actionable insights.
Tools for Tracking Recruiting Metrics
Your Applicant Tracking System (ATS) should serve as the backbone of your dashboard. Many platforms, like Tracker ATS & CRM, come with built-in KPI dashboards offering real-time lifecycle reporting and features like "Big Screens" for team-wide visibility . Sage HCM is another strong option, automating metrics like time-to-hire and diversity tracking while integrating seamlessly with ERP systems for precise cost-per-hire calculations . For technical roles, tools such as CoderPad and CodinGame can track interview-to-hire ratios specifically for coding assessments .
Other tools can add even more depth to your dashboard. Inrecruiting uses AI to automate screening and CV parsing, boosting conversion rates . Fetcher enhances sourcing efforts with automated tools and analytics dashboards that monitor ROI and pipeline diversity . For tracking the effectiveness of your sourcing channels, Google Analytics remains invaluable for identifying where career page visitors come from and which channels drive conversions . The most efficient setup connects your ATS with these specialized tools, eliminating manual data entry and keeping metrics up-to-date. This integration ensures your team focuses on hiring quality rather than just speeding through the process.
Reporting Cadence and Stakeholder Alignment
To keep your recruiting process on track, review pipeline movement and stage conversion rates weekly with your team. This allows you to address workflow issues as they arise . On a quarterly basis, present metrics like Quality of Hire and Cost-per-Hire to leadership. These insights not only justify your budget but also align recruiting efforts with broader business goals . For ongoing collaboration, hold regular discussions with hiring managers to tweak job descriptions if you notice a low "Qualified-to-Contacted" ratio .
Automating feedback collection is another way to streamline your reporting process. Use surveys to gather candidate Net Promoter Scores (NPS) and hiring manager satisfaction at key points in the funnel . Make dashboards visually accessible - shared digital displays or "Big Screens" can provide real-time pipeline updates for engineering teams without the need for constant check-ins . When metrics reveal issues, use weekly reviews to assign specific fixes rather than just acknowledging the data. This structured approach not only resolves current challenges but also sets a solid foundation for benchmarking against industry standards.
Benchmarking Your Metrics Against Engineering Hiring Standards
Once your KPI dashboard is set up, the next step is comparing your performance to industry standards. This helps highlight areas where your hiring process could improve.
However, relying on broad industry averages can be misleading. For instance, the US average time-to-fill is 44 days, but this figure combines quick-turnaround retail hiring with more complex engineering roles. To get an accurate picture, you need role-specific and market-specific benchmarks. These tailored benchmarks provide the clarity needed to set realistic timelines and cost expectations for different positions .
Understanding Technical Hiring Timelines
Hiring for technical roles typically takes longer than other industries. In tech, the median time-to-hire is 48 days - 26% slower than the global median. Here's a breakdown of typical timelines:
- Software engineering roles: 40–50 days
- Data science and machine learning roles: 55–70 days
- Senior-level positions: Add about 20% more time to the above estimates
For example, if hiring a senior backend engineer takes around 60 days, this may reflect the complexity of the role rather than inefficiency .
That said, inefficiencies in your process could still cause delays. Technical hiring channels often produce a high volume of applications, but bottlenecks can occur in the final decision-making stages. To address this, strategies like implementing a 72-hour decision deadline after final interviews can significantly reduce hiring time .
Financial Benchmarks for Technical Hiring
Costs for technical hiring vary widely depending on the role:
- Standard technical roles: $6,000–$7,000 per hire
- Specialized roles (e.g., machine learning engineers, security architects): Over $12,000, due to the added recruiter time and complex interview processes
- Executive searches: Around $28,329 per hire, with an offer acceptance rate of 79%
Beyond cost, quality metrics are just as important. For example, the average time-to-productivity for new hires is 28 weeks, and only 32% of organizations effectively measure quality of hire. This lack of measurement has led to teams interviewing 40% more candidates per hire in 2024 than they did in 2021, with no noticeable improvement in outcomes .
Making Benchmarks Work for You
Use these benchmarks to evaluate your internal processes. Instead of relying on blended averages, break down your data by role difficulty and seniority. Compare your current performance to historical data to track progress. This kind of segmentation not only helps you identify inefficiencies but also aligns with a quality-first hiring approach that complements your earlier developer recruitment KPIs .
How daily.dev Recruiter Provides Built-In Quality Signals
When it comes to sourcing candidates, efficiency is only part of the equation. Quality matters just as much, if not more. That’s where daily.dev Recruiter stands out, thanks to its built-in quality signals. Unlike traditional platforms that leave recruiters sorting through endless unqualified applications, daily.dev Recruiter connects you directly with skilled developers who are active within a professional network designed specifically for software engineers. This approach prioritizes quality over quantity, using metrics like the qualified rate by source - the percentage of candidates who meet your role's requirements - to measure success .
So, how does the platform generate these quality signals? It tracks developer engagement in real time. Think activities like reading technical articles, acquiring new skills, or participating in relevant discussions. These signals provide richer, more dynamic insights than static resumes or outdated profiles ever could . And when a developer opts into a conversation, it’s not just a cold lead - it’s a warm, double opt-in introduction. This predictive, engagement-based model doesn’t just make screening easier; it sets the stage for better hiring outcomes.
This system is especially powerful in tackling a well-known challenge: the skills gap. Nearly 69% of employers report difficulty finding candidates with the right skills . By allowing developers to showcase their interests and expertise through active participation, daily.dev Recruiter creates a trust-based matchmaking process. The result? Faster hiring times, higher-quality candidates, and improved metrics like your source quality ratio and stage conversion rates.
Gone are the days of relying on outdated databases or wasting hours screening unqualified applicants. With daily.dev Recruiter, you get a sourcing channel where intent and credibility take center stage. The payoff? Less time spent on dead ends, quicker access to qualified candidates, and a platform that drives real results for your hiring goals.
Building a Quality-First Recruitment Strategy
A quality-first recruitment strategy shifts the focus from quick placements to long-term team success. This approach emphasizes aligning hiring decisions with performance over time, addressing a key challenge in recruitment today. While many companies gather data, only 32% believe they effectively measure quality of hire . This highlights a major opportunity for technical recruiters who focus on meaningful metrics.
The first step? Define and standardize your KPIs. Stick to three to five core metrics - such as Quality of Hire, Offer Acceptance Rate, and 90-Day Retention - and apply them consistently across technical roles . Trying to track everything at once can dilute your efforts. Instead, break down data by role complexity and department to identify specific problem areas . For example, measuring a backend engineer’s performance by the same standards as a junior frontend developer isn’t helpful. Standardizing KPIs ensures every role is evaluated on its own terms, creating a solid foundation for actionable insights.
"Quality of hire measures whether a placement performs and stays, not just whether a role gets filled. This KPI protects staffing teams from 'fast but wrong' hiring." – Tracker-RMS
Regularly reviewing these metrics is crucial. Weekly KPI reviews can quickly uncover bottlenecks, whether it’s a slow interview process, ineffective sourcing channels, outdated developer sourcing tools, or delays in post-interview decisions . Case studies show that setting firm deadlines for decisions significantly boosts hiring efficiency and offer acceptance rates . These reviews build on the efficiency techniques discussed earlier, ensuring timely adjustments when issues arise.
The payoff? Stronger hires, better retention, and a more confident team. By prioritizing quality over speed, you’re not just filling roles - you’re creating teams that perform and leave a lasting mark.
FAQs
What’s the best way to define “quality of hire” for technical roles?
When it comes to technical roles, “quality of hire” is best measured by assessing how new hires contribute to the company’s performance. Key indicators to track include:
- Offer acceptance rate: A high acceptance rate suggests your hiring process is attracting the right talent.
- 90-day retention: This shows whether new hires are staying and adapting well in the early stages.
- Hiring manager satisfaction scores: These scores reflect how well new employees meet expectations and align with team needs.
By focusing on these metrics, companies can link hiring success to overall business outcomes, ensuring they prioritize both the immediate and long-term value of their hires.
How do I find the biggest bottleneck in my engineering hiring funnel?
To spot bottlenecks in your engineering hiring process, take a close look at the metrics tied to each stage of the funnel. For example, if there’s a lag between the final interview and the offer, it could indicate delays in decision-making, such as slow managerial approvals.
Key metrics to monitor include pipeline health metrics like:
- Source quality ratio: How effective your candidate sources are.
- Stage conversion rates: The percentage of candidates advancing through each step.
- Candidate NPS (Net Promoter Score): How likely candidates are to recommend your hiring process.
Combine these with sourcing efficiency metrics, such as response rates, to identify inefficiencies. This approach helps you refine your process, leading to quicker decisions and better-quality hires.
Which recruiting KPIs should I prioritize on a technical recruiting dashboard?
When building a technical recruiting dashboard, it's important to focus on metrics that highlight both the quality of hires and the health of your hiring pipeline. Here are the key performance indicators (KPIs) to include:
- Quality of Hire: Measures the effectiveness of your hiring decisions, often based on performance reviews and manager feedback.
- Offer Acceptance Rate: Tracks how many candidates accept your job offers, giving insight into the competitiveness of your offers and employer brand.
- 90-Day Retention: Evaluates how many new hires stay beyond their first three months, reflecting the success of your onboarding and hiring process.
- Sourcing Quality Ratio: Assesses the efficiency of your sourcing channels by comparing the number of sourced candidates to those who advance in the hiring process.
- Stage Conversion Rates: Analyzes how well candidates move through each stage of the recruitment funnel, helping identify bottlenecks.
- Response Rate: Indicates how often candidates respond to outreach efforts, providing feedback on your messaging and outreach strategies.
- Candidate NPS (Net Promoter Score): Measures candidate satisfaction with the hiring process, offering valuable insights to improve their experience.
By tracking these KPIs, you can make more informed, data-driven decisions to refine your recruitment strategy and achieve better hiring outcomes.
.png)